Clarofy Features: Regression
Create a model in Clarofy
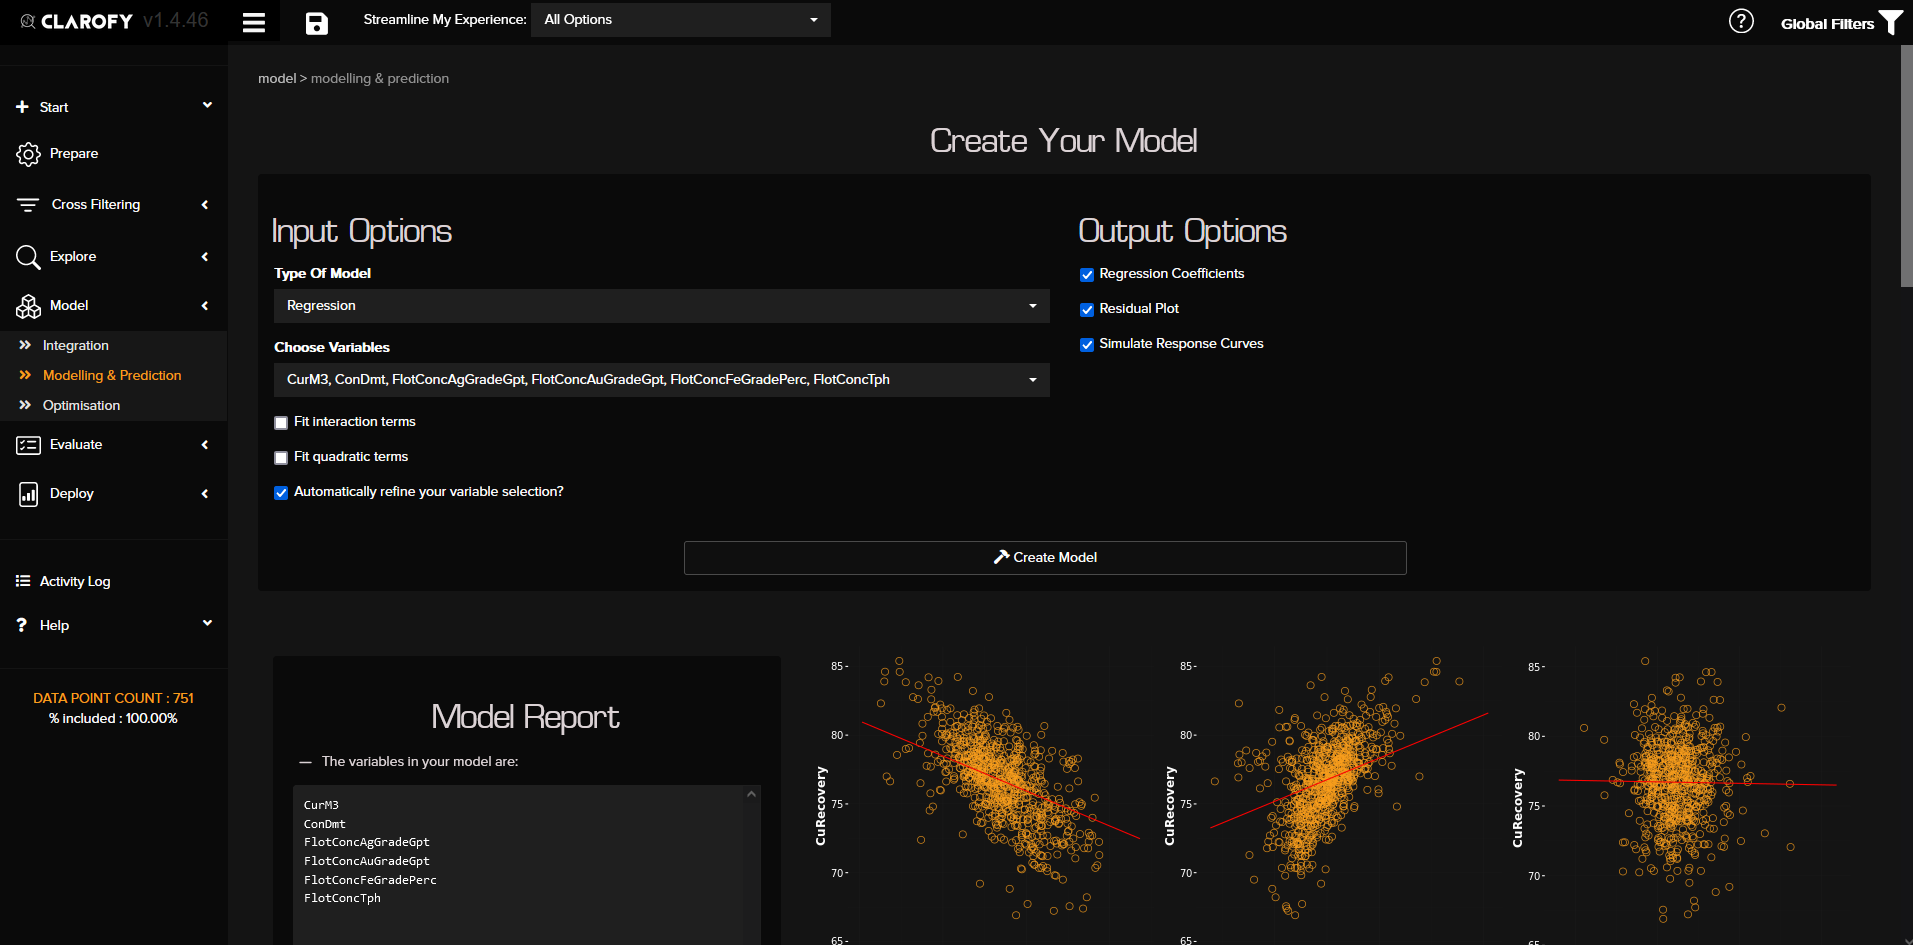
The Modelling and Prediction tool in Clarofy allows us to create a model to fit our data. If the fit is good, it might help us understand what decisions we can make to improve our KPI.
There are 3 options for type of model: Regression, XGBoost and support vector machine.
- Regression: Linear regression is a data-scientist's vanilla ice cream. It creates a model with easily interpreted outputs (model coefficients) and allows you to validate whether the model assumptions are reasonable. If the model residuals (difference between observed values and values predicted by the model) are normally distributed, then linear regression might be suitable for your data.
- XGBoost: If the process you are modelling has interactions between variables that you aren't easily able to include in your own data set, then XGBoost (a type of decision tree model) may be able to detect this behaviour 'by itself'. It also allows for the inclusion of missing data, so you may retain more of the information in your data set without having to recode it manually and make a poor assumption about what to put in its place.
- Support Vector Machine: Support Vector Regression (SVR) can allow for modelling non-linear relationships between variables by the use of a non-linear kernel function, but it can't handle missing data. It might be better suited for extrapolating predictions than XGBoost, but it will likely perform best when using smaller data sets with less features.

Select the variables that you want to adjust for in the model – this means that you want to see how they confound or modify the effect of your variable of interest on the KPI. If you investigated correlation earlier, you might have an idea of some predictors (independent variables) that might have a really high correlation with one-another; you may only want to select one of the pair/triplet/quartet/etc to avoid multi-collinearity issues.
In output options, check the boxes that you want to see for each predictor.
- Coefficients will only be shown for Linear regression models, as they do not exist for the other models.
- The Residuals plot shows the R2 (error) considerations: a plot of modeled vs actual values and the error metrics.
- The response curves shows the newly modeled variables against your KPI.

If you check the 'Fit Quadratic Terms' box, you will be able to see a quadratic equation for your curve. This regression model can then be exported by copying the model formula in the 'Model report' box.
Currently XGBoost and Support Vector Machine models cannot be exported outside Clarofy, so keep an eye out for that capability in an upcoming release!
Let us know if this article was helpful and what else you'd like to see in ClaroMente.
We are always adding more features to Clarofy, so if there's a specific evaluation (or other!) tool to would like to see included, let us know.