Clarofy Features: Correlation
How to use the Correlation feature to ascertain which variables in your dataset are affected by each other

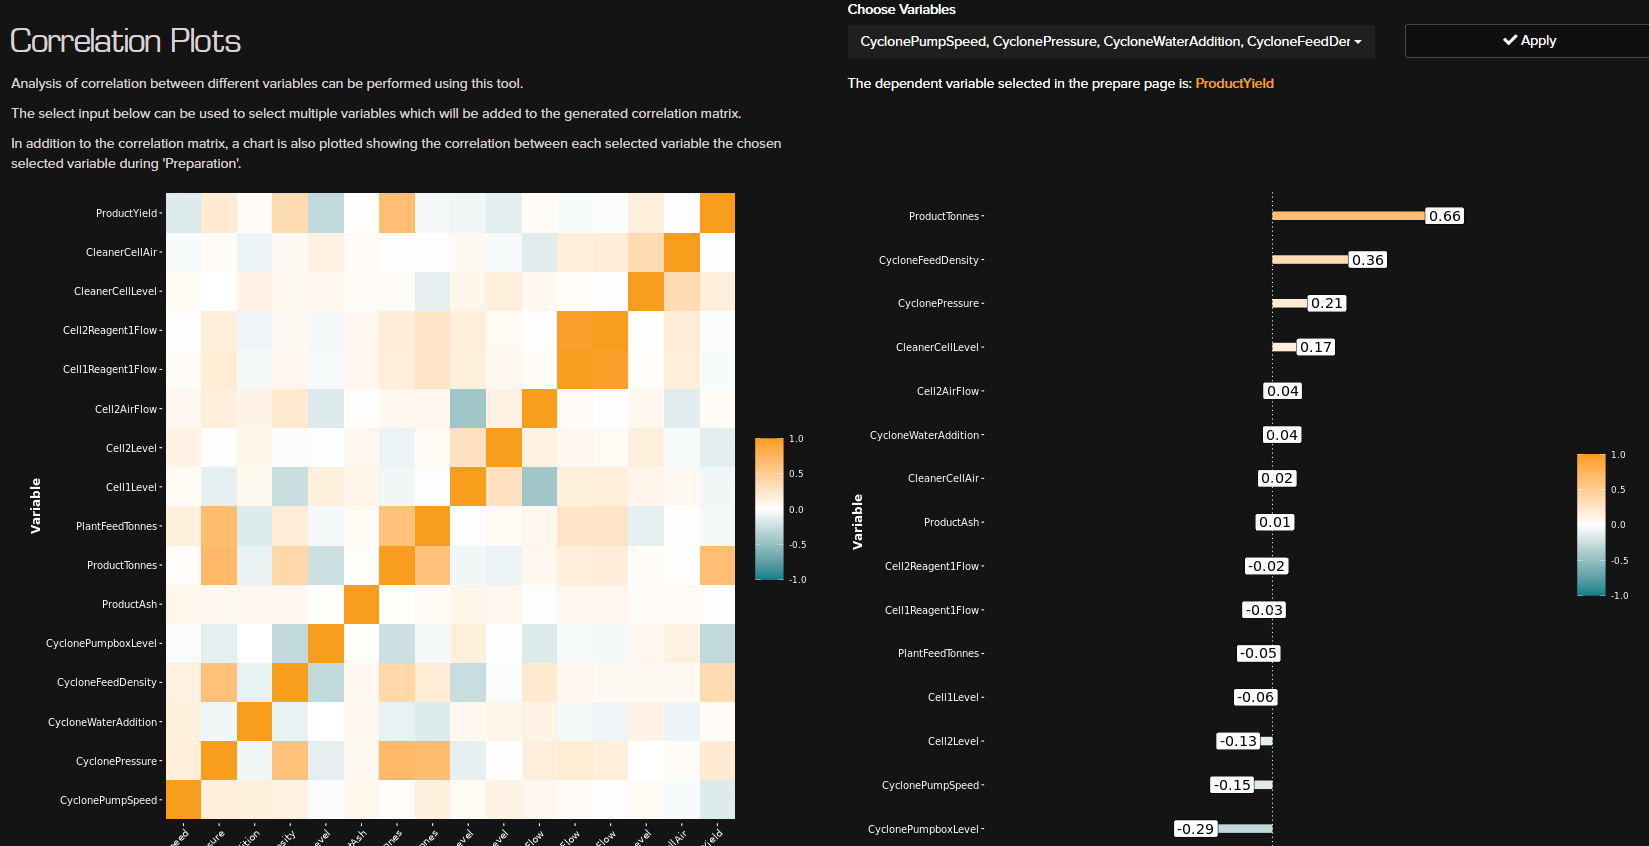
This tool can be used to find out the statistical value of the correlation between your variables. You would do this if you want to find out if a relationship that you visually recognised has statistical importance. An example might be, you noticed that your flot feed pump speed has a negative relationship with your KPI (eg: tails grade) in an exploration plot. You might use the correlation matrix to make sure that the Pearson Correlation between the two is >-0.5, which could indicate a strong negative correlation. The selection of 0.5 is arbitrary and you would decide what a strong correlation would be in relation to all your variables.
The discovery of a strong or week correlation would be the catalyst for further analysis and can result in decisions to change the levers that are pulled in a processing plant to optimise your KPI.
Hope these tips help, and let us know what else you'd like to see in these articles!
Exploration
The exploration plots page allows you to investigate and discover trends, relationships, inflexion points and more.