Clarofy Features: Data Validation
How to upload and validate your dataset
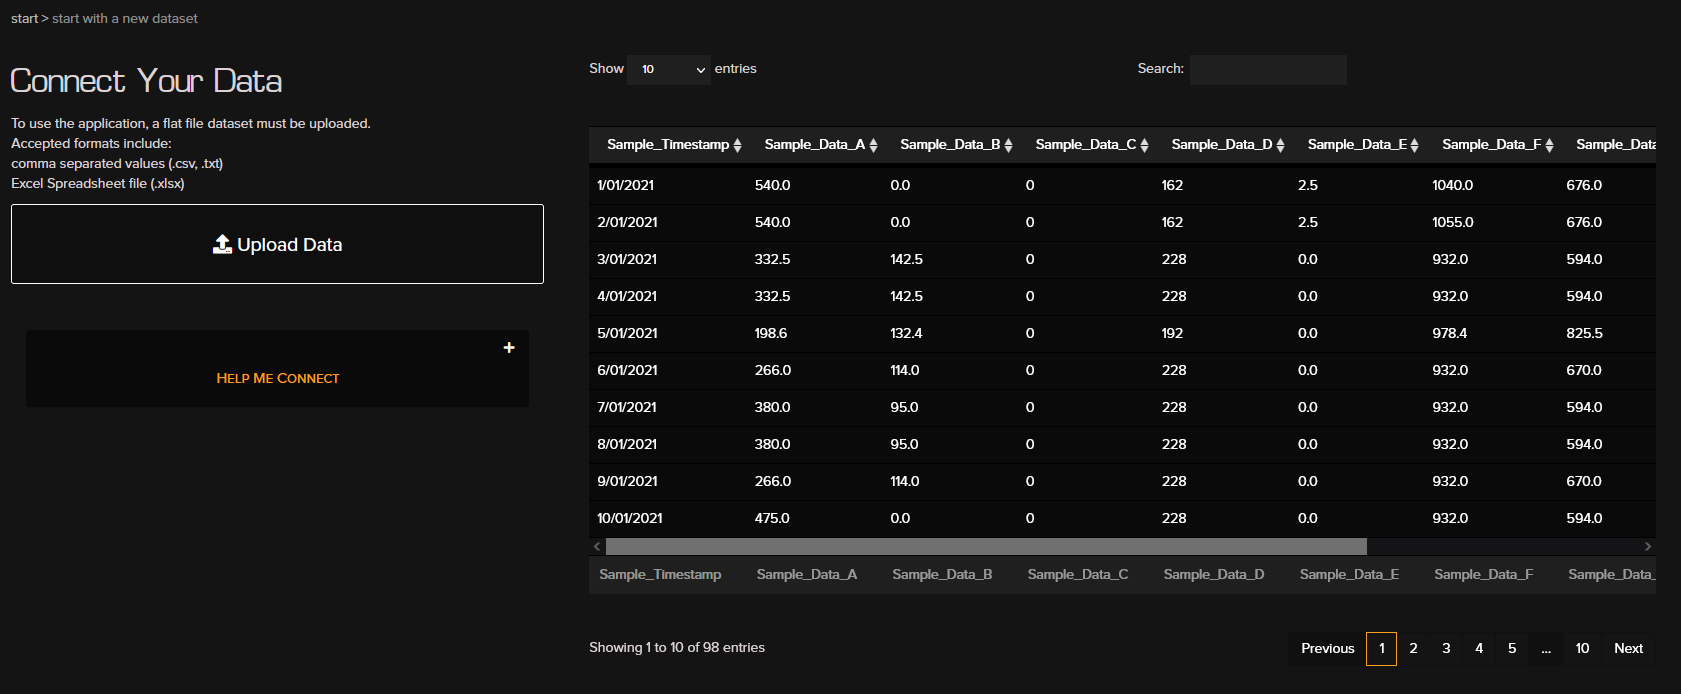
Upload a dataset: When you 'Start New' in Clarofy, you will see the screen above. Click on the ‘Upload Data’ button and select an excel, .txt or .csv file.
The table on the right hand side is a sample showing what your data should look like. If you have a TimeStamp variable, having it clearly labeled with a name that includes 'Date', ''Time', 'Month', 'Year', or a similar word will help Clarofy identify it. Having each variable is its own column is the most straightforward way to bring data into Clarofy, although a pivoted table may sometimes work.
There is no upper limit on file size, but the more columns and rows your table has, the longer it will take to complete certain operations. At time of publication, Clarofy completes operations on a 20000-row table with ease. Use the 'Data Point Count' on the left panel to check how many rows your table has.
Clarofy can accept .xls, .xlsx, .csv and .txt files. We are currently working on different methods to input your data so stay tuned for updates!

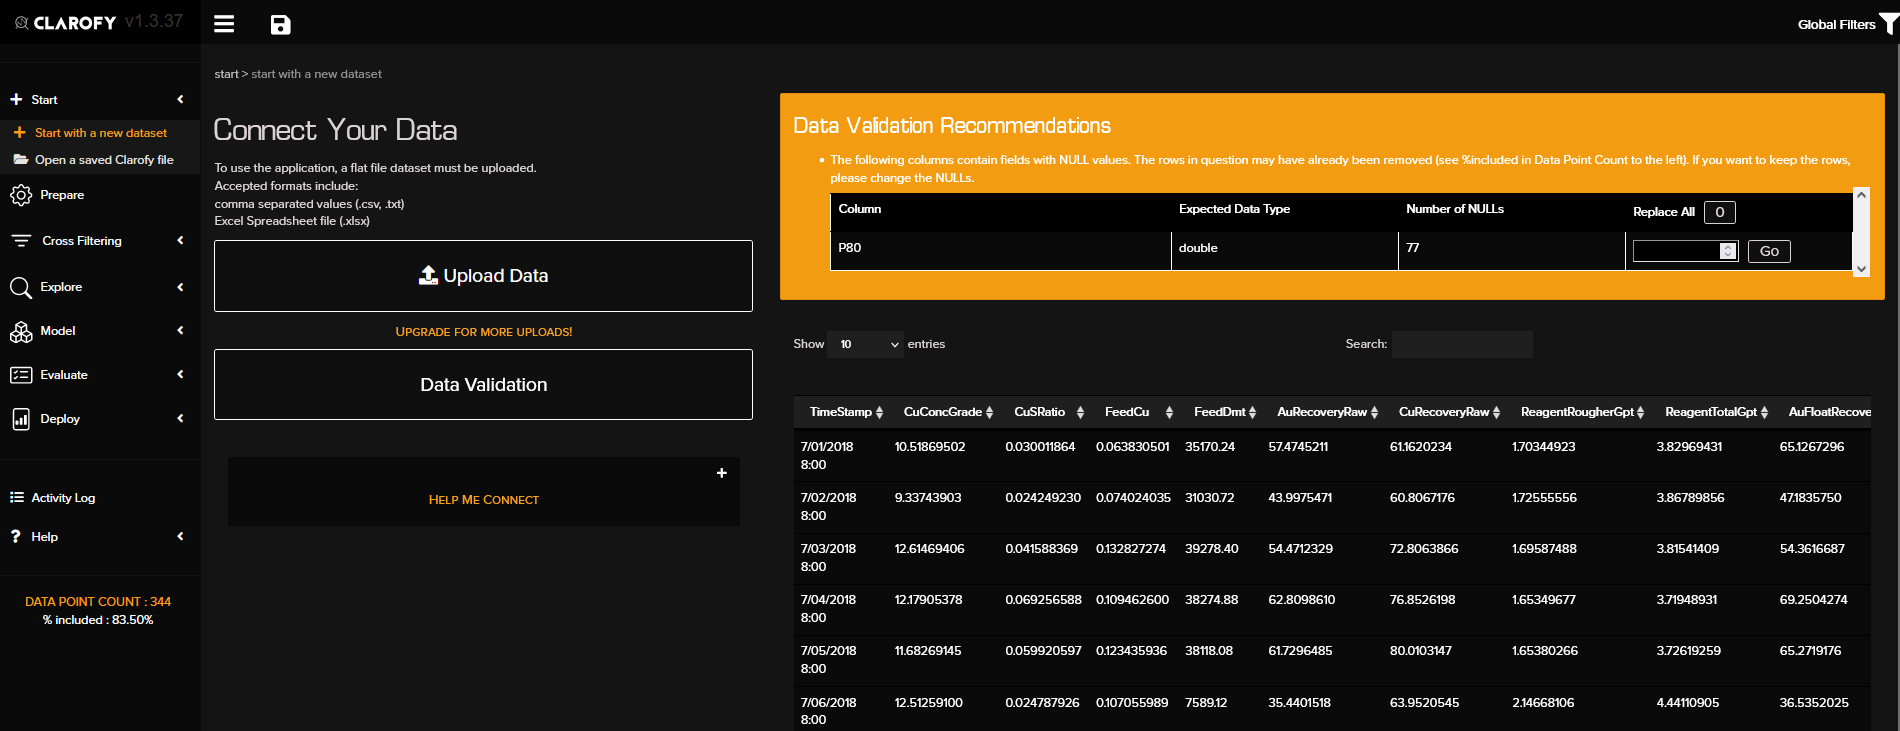
Clarofy Validation: Once your dataset is uploaded and visible on the right hand side, you can use the Validation feature of Clarofy to check for any potential issues with your data. Common problems that can affect your analysis are
- NULL values; where there is no value in a certain field. Looking at an aggregational value of that variable, such as in a frequency histogram, can give you an inaccurate/distorted result if there are too many NULLs. This is a recurrent problem with processing data, especially if you have joined tables with different frequencies of data.
- Data is in a non-numeric format. Again, this does not stop you from analysing your data but it may be worth checking that the variables that you are expecting to be numeric/integer are in fact those types.
General thoughts: Before starting your analysis, it helps to have an overarching question or hypothesis that you're trying to answer or validate. During analysis, it can be easy to lose track of the aim/purpose when there is a lot of data available. Returning to the hypothesis and the value driver regularly will help get you to the final result.
On the Prepare page, we can select the KPI (variable of interest that you are testing). Common processing plant KPIs are recovery, yield and tails grade. Depending on the limits of your hypothesis; e.g. you might be just looking at a flotation circuit; your KPI might be froth depth or flot recovery. Use the exploration tools to find relationships and inflexion points. The ‘Integration’ tool allows you to remove the effect of a variable on your KPI, which can give you a better idea of correlatability. A t-test can help verify if the means of 2 groups of data are significantly different.

Hope these tips help, and let us know what else you'd like to see in these articles!