Clarofy Features: Evaluation
How to use the Evaluation features of Clarofy to make decisions based on your data.
The tools in the Evaluate section of Clarofy allow you to make a statistical evaluation of your data, which will help make decision about the ‘population’. This is different from the exploration tools where you might make a visual judgement but may not be able to exactly quantify the measurement/slope/improvement. An evaluation would be required for decision-making, especially when resources need to be allocated.
Most data that we have can be considered a 'sample' as there is more where that came from. We make assumptions that a trend or relationship seen in the sample data is going to be reflected in the population. For example: we might collect processing plant data from the last year and make assumptions that the relationships we uncover have always been true, although what we have is the relationship being true for a subset of time. Or we might collect height data from 1000 residents of a city and make assumptions about the whole city's heights. Statistical evaluations like T-tests and ANOVA can give us an indication of whether these assumptions are likely to be true and to what extent.

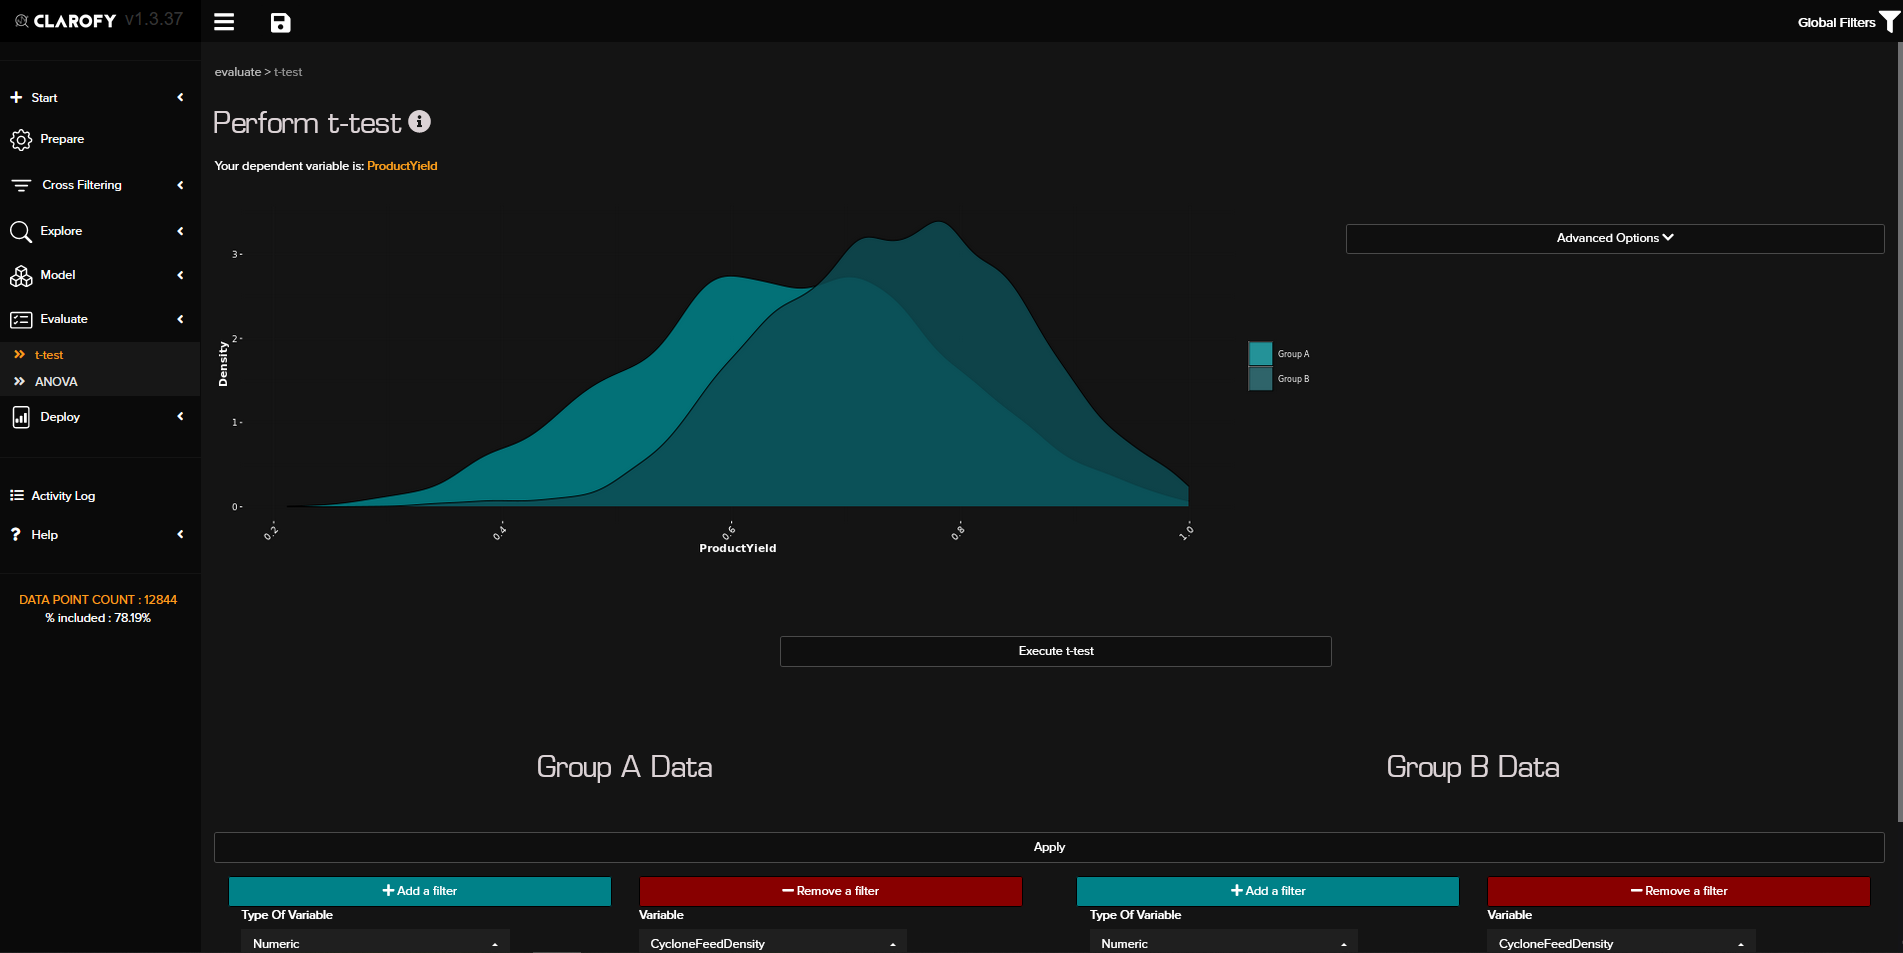
T-Test: This tool allows you to compare the means of two groups, often useful in hypothesis testing. For example, a null hypothesis might be that the addition of a different reagent caused no difference in final recovery in the plant. The alternate hypothesis being that the difference in final recovery is not zero.

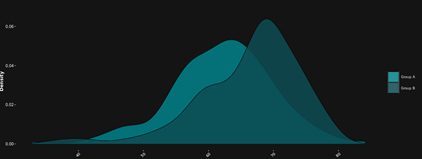
The density plot shows the two distributions of the two groups once the ‘Apply’ button has been clicked. The ‘Execute t-test’ button gives a table of values on the right, as well as an interpretation below.
ANOVA (Analysis of Variance): This chart type shows the variances between groups if you have a categorical variable to split the dataset into groups. A numerical or continuous variable can be changed/transformed into a categorical variable outside Clarofy in your tool of choice. For example, if you have a mode variable with more than 2 modes (Auto, Manual and Sequence, say), you can use an ANOVA to verify that the modes result in different values of the KPI.

We are always adding more features to Clarofy, so if there's a specific evaluation (or other!) tool to would like to see included, let us know.