Knowledge Base: Deploy
Time and effort spent on data analytics is not helpful unless we take action and solve a problem.
In a typical Data Science workflow, the Deploy phase is where the true value is realised. To read about the other steps in a Data Science workflow, you can go to the corresponding articles for each of them.


Here are some things to think about when deploying a solution:
- How will you engage with your end users and communicate your solution?
- How will you track your implementation?
- How will you ensure the implementation is still relevant at the timeframe of deployment?
Using Data Science techniques is only effective if you can generate actionable insights aligned to your strategy. A related topic to this is the sustainability of your solution: If it's a model, how often will it need to be re-run? If it's a physical solution, how often does it need to be replaced? If it's a change in procedure, is there sufficient change management principles around it?
Let's talk about communicating your analysis to your stakeholders. If the initial hypothesis/business understanding has been clearly defined and referred to throughout the exploration and analysis, this part will be easy! Put yourself in your stakeholders' shoes and keep your data story focused on what's in it for them. Highlight a single measurement or insight or action that your audience can engage with and come back to it at the conclusion.

In order to communicate the success of your analytics project and the need for further change, you can use the following tools to make a compelling case:
-
Immediacy: Use timely data.
-
Personalisation: People pay more attention when information is about them or about things they care about. You can even try having multiple versions of charts when you are facing different audiences.
-
Interpretation: Present your insights with a simple visual experience. Don't assume the data is easily or universally interpreted.
-
Authenticity: Data should be authentic,well-sourced, and show the ways that bias has been mitigated
-
Reduce Friction: Know your audience well enough to be aware of their expectations and motivations out of the report or session. Choose summary charts wisely to ensure they give enough detail but not too much. Incorporate a visual hierarchy into the reporting.

Make your results actionable and sustainable:
- Ask the right question of stakeholders: What are their aspiration and challenges?
- Measure the right things: what is important to the business?
- Use segmentation to drive action: choosing which segment to study depends on the business question you want to answer
- Build a robust action plan on how to embed the changes and ensure sustainability
- Monitor results (inputs, activities, outputs, and impacts) and the contextual factors of any trials or implementations to better understand the progress towards reaching the objective
- Gather user feedback from implementation
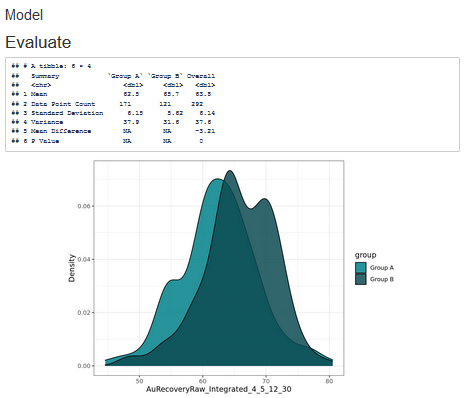
Clarofy can produce html reports of your analysis, as well as keep track of your activity log. Exporting data and graphs to other applications coming soon!
Hope these tips help, and let us know what else you'd like to see in these articles!
Evaluate your data
See true value potential chance and make data-driven decisions.