Knowledge Base: Linear Regression
Linear regression analysis is used to predict the value of a variable based on the value of another variable.
Linear regression is a basic and commonly used type of predictive analysis. The variable you want to predict is called the dependent variable. The variable you are using to predict the other variable's value is called the independent variable.
In Clarofy, the prepare page includes a section to chose your dependent variable. This will affect the y-variable in the Exploration sections of the app.


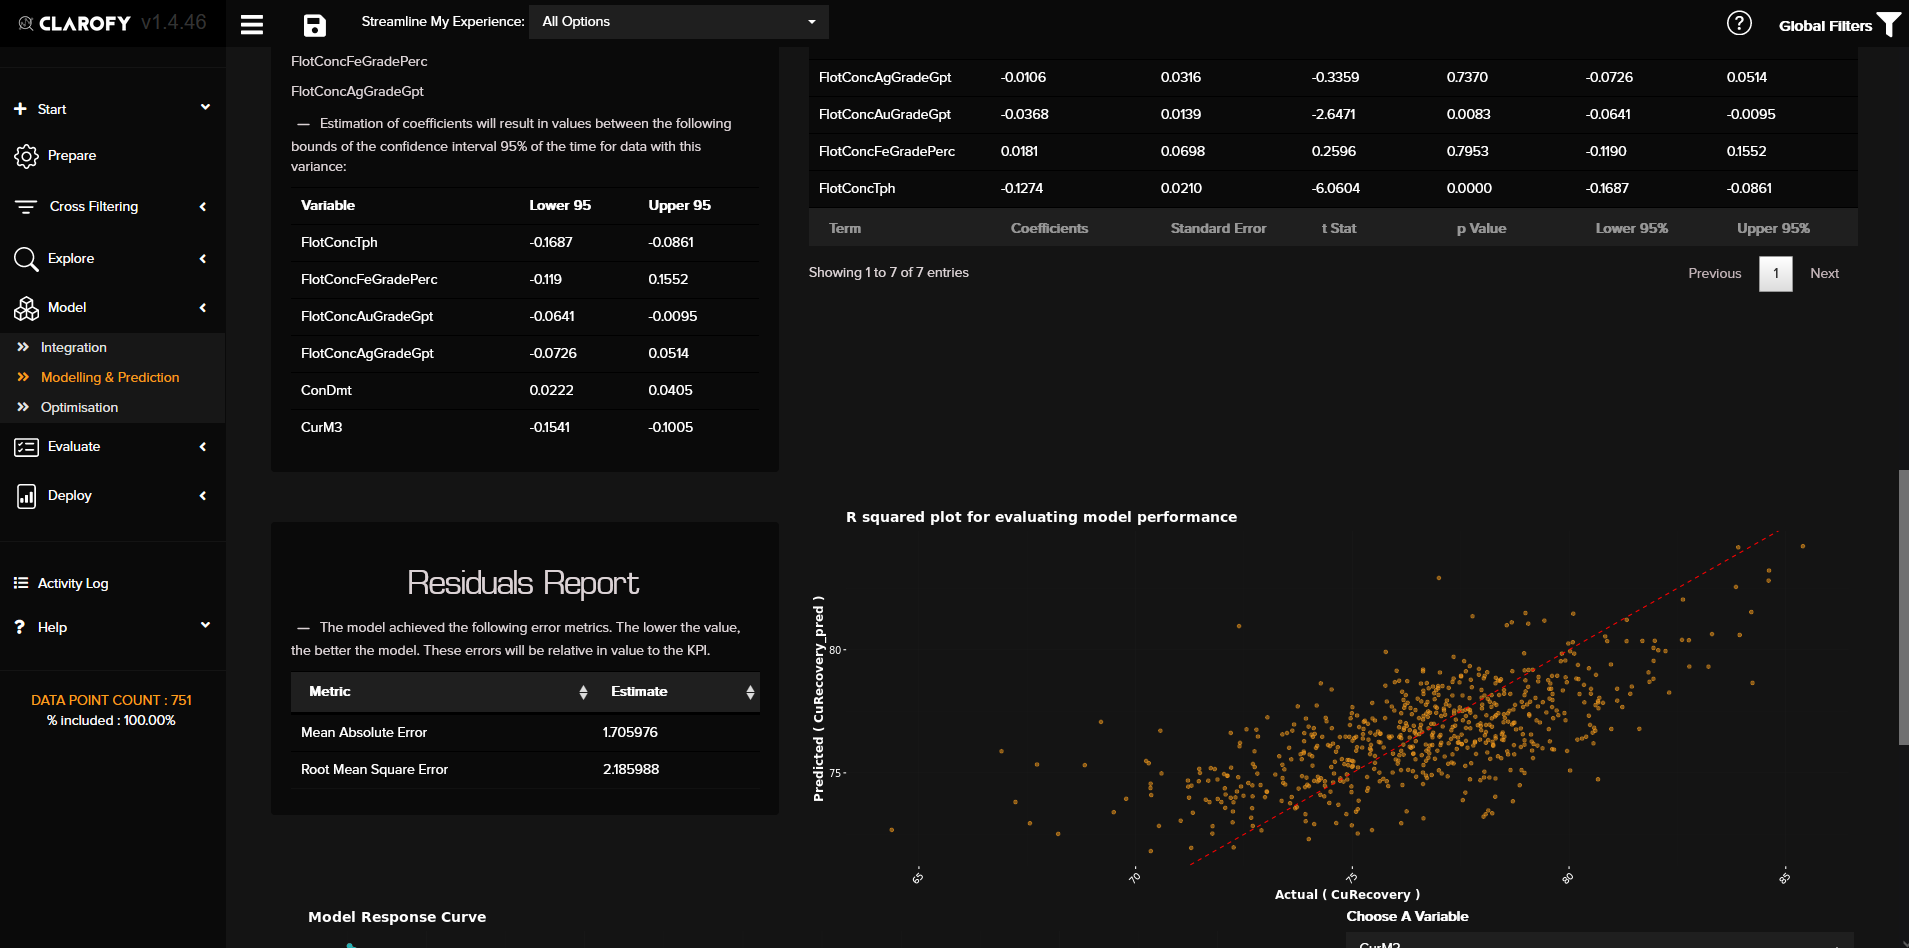
This form of analysis estimates the coefficients of the linear equation, involving one or more independent variables that best predict the value of the dependent variable. Linear regression fits a straight line or surface that minimizes the discrepancies between predicted and actual output values. There are simple linear regression calculators that use a “least squares” method to discover the best-fit line for a set of paired data. You then estimate the value of X (dependent variable) from Y (independent variable).
Linear regression is a data-scientist's vanilla ice cream. It creates a model with easily interpreted outputs (model coefficients) and allows you to validate whether the model assumptions are reasonable. If the model residuals (difference between observed values and values predicted by the model) are normally distributed, then linear regression might be suitable for your data.
Types of Linear Regression
- Simple linear regression: 1 dependent variable (interval or ratio), 1 independent variable (interval or ratio or dichotomous)
- Multiple linear regression: 1 dependent variable (interval or ratio) , 2+ independent variables (interval or ratio or dichotomous)
- Logistic regression:1 dependent variable (dichotomous/binary), 2+ independent variable(s) (interval or ratio or dichotomous)
There are other types of regression based on the types of data you might have.
When selecting the model for the analysis, an important consideration is model fitting. Adding independent variables to a linear regression model will always increase the explained variance of the model (typically expressed as R²). However, overfitting can occur by adding too many variables to the model, which reduces model generalizability. Occam’s razor describes the problem extremely well – a simple model is usually preferable to a more complex model. Statistically, if a model includes a large number of variables, some of the variables will be statistically significant due to chance alone.

Clarofy's
An important tip: Using Data Science techniques is only effective if you can generate actionable insights aligned to your strategy. A related topic to this is the sustainability of your solution: If it's a model, how often will it need to be re-run? If it's a physical solution, how often does it need to be replaced? If it's a change in procedure, is there sufficient change management principles around it?
Hope this has helped! For more help, contact us, or look up the following resources:
Let us know what else you'd like to see in these articles!
Deploy your data
Time and effort spent on data analytics is not helpful unless we take action and solve a problem.
Time Series
How to analyse continuous data.