Clarofy Knowledge Base: Prepare
Once your data is connected, it usually needs to be cleaned and manipulated before analysis.
Let's go back to our Data Science Workflow. It usually starts with a Hypothesis or Business Understanding, and then Connecting your data. We talk about these in separate articles of this knowledge base. The main stages of a typical workflow are illustrated below, and in this article, we will focus on the Prepare stage.


Here are some things to think about during this stage:
Why would we need to clean data?
- Data Accuracy: We don’t need data that is affected by bad sensors or taken at a non-typical time.
- Data Consistency: We want to make confident decisions based on any part of the data
- Data Validity: All our analyses should work on the data; it should be in the right format etc
- Ensures models are looking at the ‘correct’ optimum operating ranges
- So that the results of analysis are not influenced by outliers
What do we aim for when we’re cleaning?
- Not too much noise
- No errors/nulls
- Reduce outliers
- Application of global filters
Let's talk about Missing data
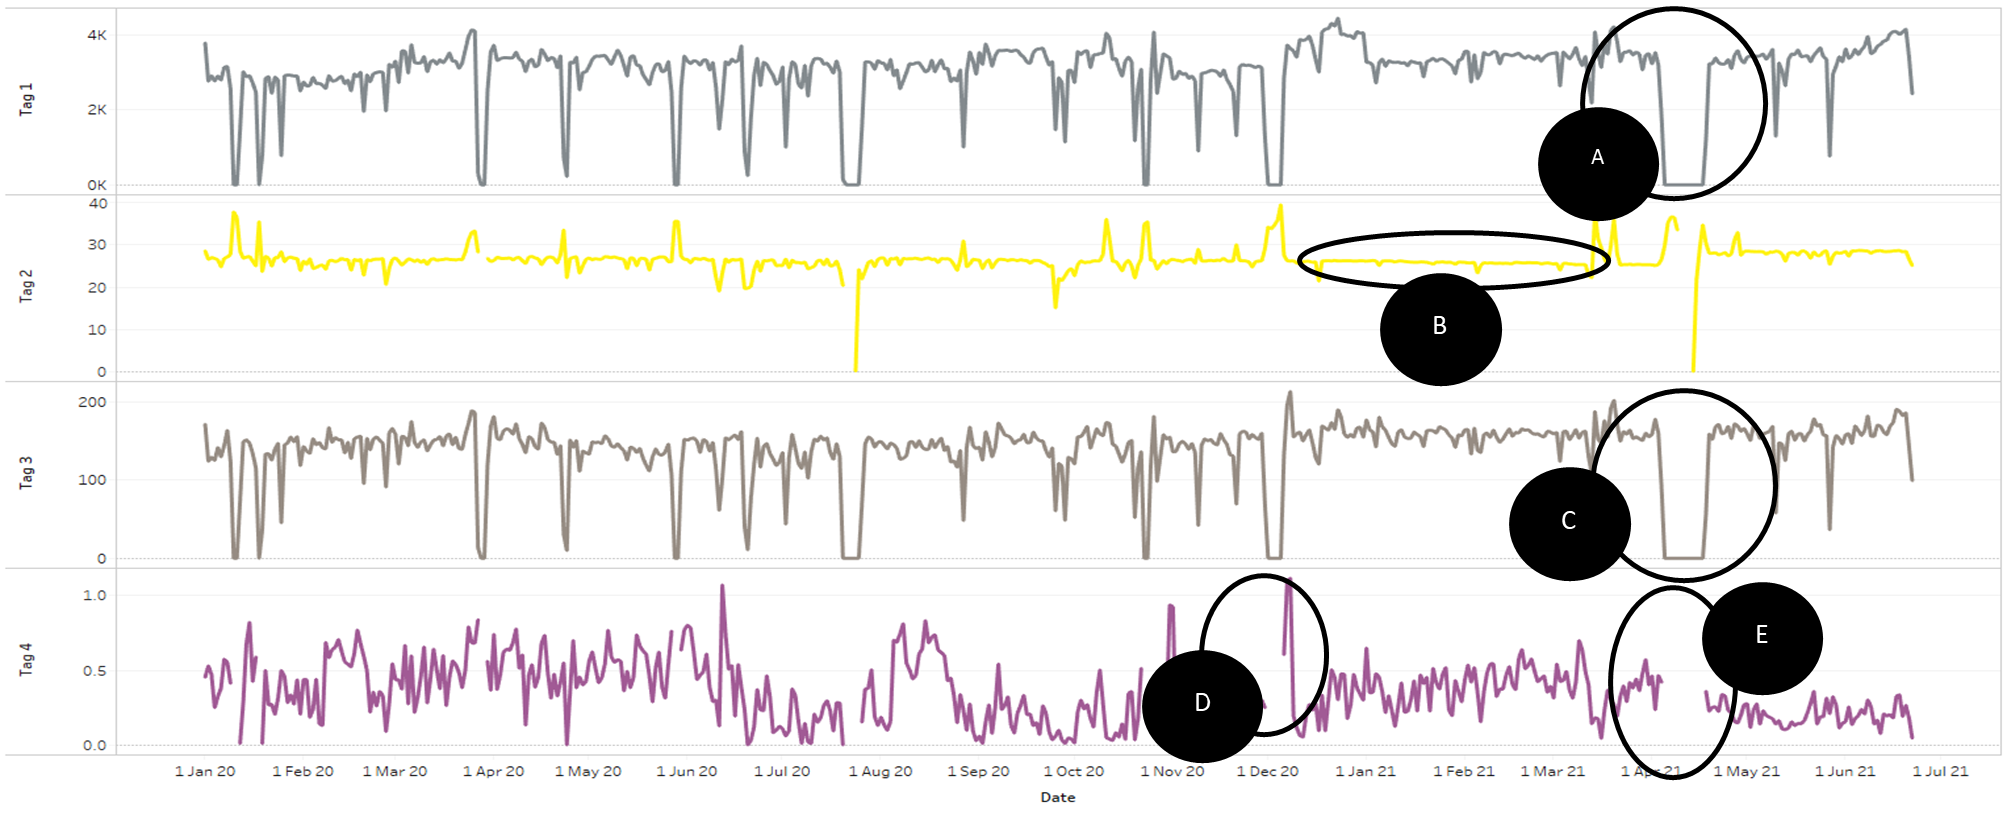
It is important to understand the reason for missing data. It is often representative of a shutdown, or switching equipment, etc. Sometimes it can also mean that there are instrument issues or data issues. Both are bad when trying to draw conclusions. Starting an analysis with a contextual understanding of how your data is behaving is invaluable.
In the below example of several timeseries plots, only D and E are showing missing data.

What about Outliers?
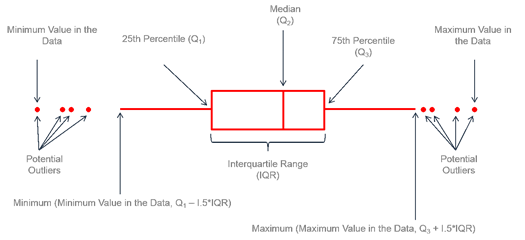
Operational data is never perfect, as I’m sure you have discovered! We need to prepare/clean it to overcome some of these issues. One of the major areas is Outliers, a relatively small proportion of data points that are far outside the Inter-quartile range of a distribution. In a box plot, they would be seen as below:

Outliers have a significant impact on many statistical measures. They can be a result of actual phenomena in the plant and hold valuable information, or they can occur due to instrument or data error or a once-off change in the plant. There isn’t an easy formula to identify whether they would need to be removed/filtered from the dataset or not, so applying local knowledge and experience is often the best way to treat them.
Filtering for outliers can be a contentious topic!
A data scientist will tell you that you should not filter for outliers unless you can statistically prove they are a real outlier. A metallurgist, however, will know that a flowmeter which reads -500m3/h is impossible and should be excluded.
Context and understanding of the data are important!
Another point to remember is to not lose sight of how much data has been filtered/excluded. Use a data point count; a simple way to pick up potential filtering or data errors.
- How many data points in your raw data?
- How many data points are left after filtering?
- Would you feel confident making a decision based on the remaining data?
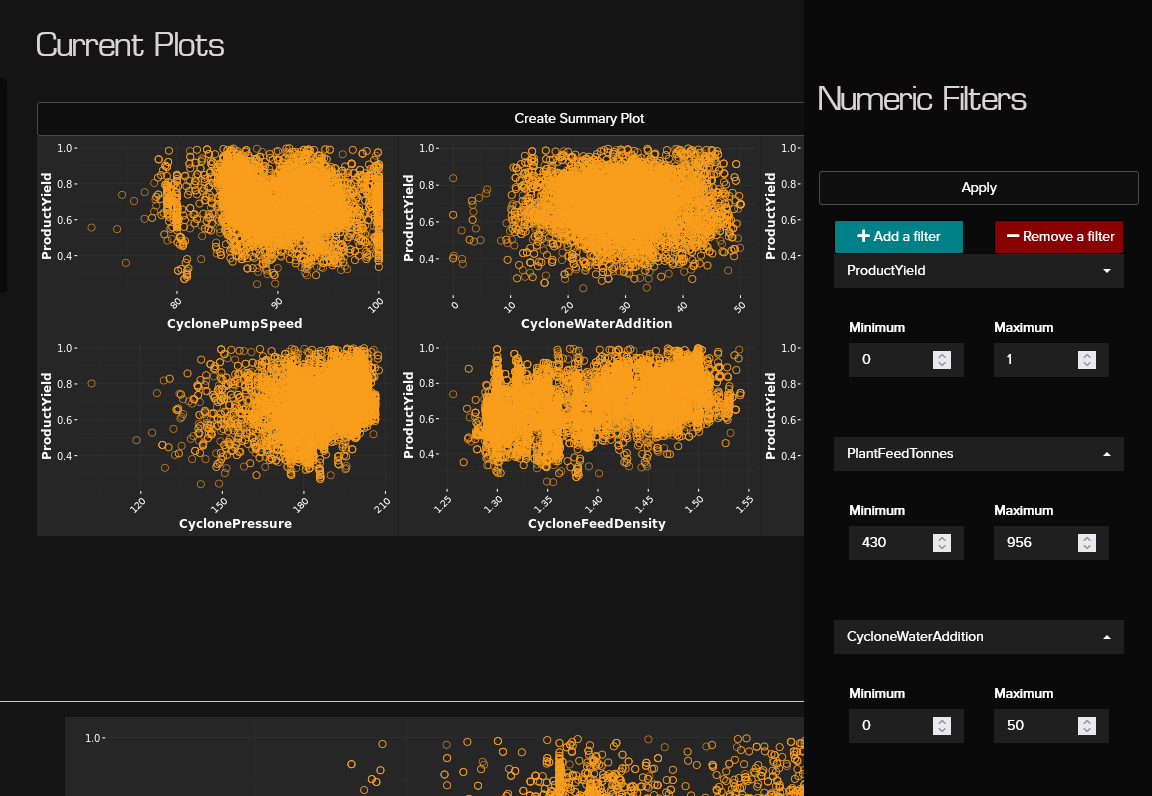
In the Clarofy app, the Global Filters are located in the top right hand side corner and you can use Numeric, Categorical or Temporal (time-based) filters for your cleaning and exploration.

Hope these tips help, and let us know what else you'd like to see in these articles!
Connect your data: Upload a dataset
Before formulating the path to your final result, you need to know how to upload your data.
Clarofy Knowledge Base: Explore
It's important to visualise your data so you can see overarching trends and pick up any areas of interest within Clarofy.