Clarofy Knowledge Base: Select
While developing your hypothesis, formulate a set of specific questions for which you want an answer. This provides a structure for your final result.
"This week I’ve seen X occur several different times when Y happens, I think it is impacting Z”
Have you thought something like the above at various times? How would you go about creating an analytics project to answer the uncertainty?
Step 1 is usually to understand the process that you're working with. Find out more about that in our initial Business Understanding article. While developing your hypothesis, it helps to formulate a set of specific questions for which you want an answer. This provides a structure for your final result. Without this structure, the problem-solving mind of a metallurgist can lead us into the common trap of 'scope-creep': when you're solving problems that you aren't getting paid to solve!
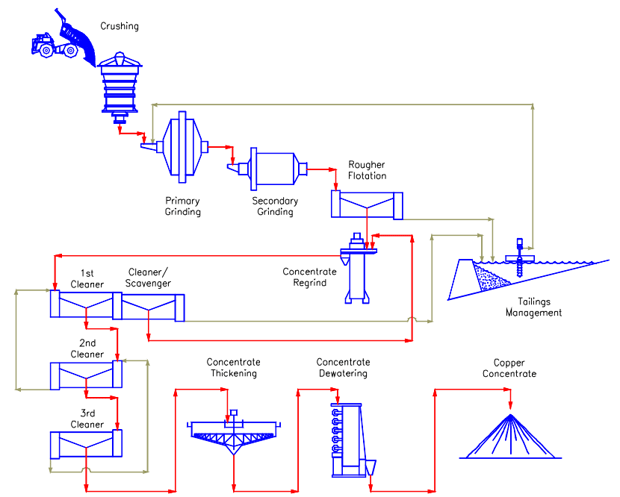
So let's assume you have your hypothesis, and now you want to figure out what data you're going to need for your analysis. The flow diagram below is a typical copper processing plant, we will use it as an example.

You have chosen the area to investigate; let's take reagent addition in the Rougher flotation circuit for example. You would collect all the tags/variables that are related to that circuit, but what about the regrind circuit? Any change to the roughers will affect the regrind, so it makes sense to collect the regrind variables as well. The grinding circuit will have flow-on effects, so perhaps you might collect some milling data.
At times it can be almost too easy to extend the breadth of the analysis by collecting a wide range of data, but more often that not, it can cause confusion and divergence from our hypothesised goal. Whilst some diverging analytics can be fruitful and insightful to provide context to problem, others can lead you to down a circular hallway with no doors. It is important to focus on the key drivers that influence and directly relate to the hypothesis.
For the times when we require a little more context outside of these key variables, it's beneficial to gather tags that closely influence or that are related to the main KPI. These might be checks for various pumps or valves to be on/off during the time period of the analysis.
Remember! it's better to have a well-conducted analysis on a small area of data with watertight assumptions, than a sprawling piece of work that is too complex and unwieldy for stakeholders to digest
Other examples of additional tags/variables for data integrity checks
-
Equipment state (on/off)
-
Valve positions (%) - flowmeter valves, pinch valves/knife gates/tail plugs
-
Current/Amps
-
Pumps - amps vs flow & slurry density
-
Weightometers - amps vs. tonnes These extra variables will go on to serve many benefits, such as
-
-
Saving time later when you're deep into the analytics and need to identify required information that isn't there. (Tag ID, extraction, ingest)
-
Allowing quick checks of data integrity and comparisons of other possible influences
-
Appeasing curiosity when problem solving, or answering stakeholder questions
In a metallurgical flotation plant (such as the example above) the variables you would be likely to include are
-
Key Information: element assays (feed, concentrate, tails), reagent additions, throughput/flow, sizing, concentrate flow.
-
Additional information!
-
Valve positions on reagent flows, slurry density, air, level, cell velocity, minor element assays.
-
Hope these tips help, and let us know what else you'd like to see in these articles!
Connect your data: Upload a dataset
Before formulating the path to your final result, you need to know how to upload your data.
Next Article - Clarofy Knowledge Base: Prepare
Once your data is connected, it usually needs to be cleaned and manipulated before analysis.